【均值回归……这对当今美国股市意味着什么?】股票均值回归是一种金融理论,它认为资产价格和收益最终会随着时间的推移回归到其历史平均水平或长期基线。当价格由于市场过度反应、恐惧或贪婪而显著偏离这一均值时,均值回归策略假设价格最终会反弹。
看看2000年至2026年中期的标普500指数数据。它完美地展现了均值回归在宏观层面的运作方式,以及它为何对当前的风险管理如此重要。
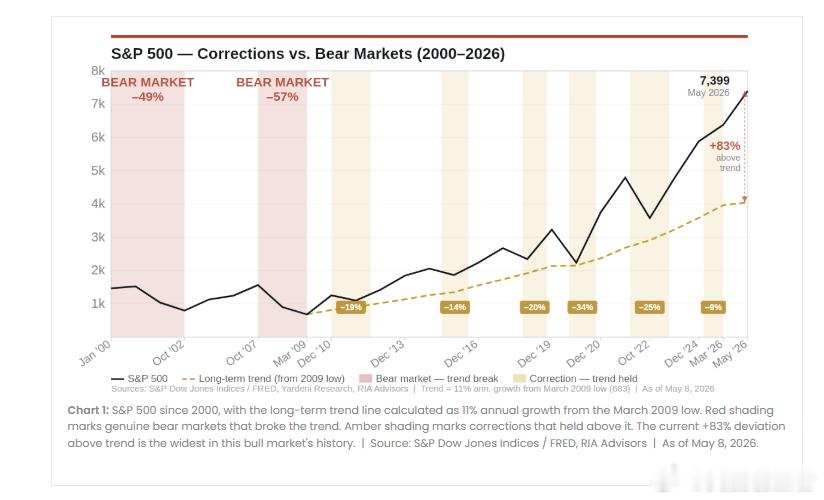
1. 历史增长基线自2009年3月触底以来,标普500指数一直遵循一条长期指数趋势线,代表着约11%的年化增长率(图中金色虚线)。这条线充当了市场的历史“均值”或引力井。
2. 回调与结构性趋势断裂市场应对偏离这条线的情况有两种截然不同的方式:
“健康”回调(琥珀色阴影):在 2011 年、2015 年、2018 年、2020 年和 2022 年,市场涨幅过大或面临短期宏观不利因素。市场出现回调(跌幅在 -9% 至 -34% 之间),但长期趋势得以维持。这些是典型的短期均值回归,在不破坏结构性牛市的情况下,重塑了投资者情绪。
结构性熊市(红色阴影):在 2000 年和 2007 年,市场并非仅仅经历了小幅回调;而是遭受了巨大的结构性断裂(分别下跌了 -49% 和 -57%),彻底切断了原有趋势,迫使市场经历了长达数年的艰难过程来建立全新的基准线。
3. 2026 年的现实:前所未有的涨势截至 2026 年 5 月,标普 500 指数已飙升至惊人的 7,399 点,比其长期趋势线高出 83%。
根据历史数据,这是本轮牛市历史上偏离趋势线幅度最大的一次。市场从未像现在这样被拉得如此之紧。
4. 投资者的启示均值回归并不能告诉我们市场何时会反转——它遵循滞后的时间线,这可能会考验投资者数年的耐心。市场涨势的持续时间可能远远超过逻辑预期。
然而,这类数据对于资产配置至关重要。当价格与历史均值之间的差距达到历史极端水平时,未来的风险回报比就会发生变化。这并不意味着你应该恐慌性抛售,但绝对意味着在认为市场涨势可以无限持续之前,你应该重新评估自己的风险承受能力。
永远不要妄想无限期地垂直攀升,要记住,重力最终总是会战胜一切。
Reversion to the Mean.... what does it mean for the stock market today?
Stock mean reversion is a financial theory suggesting that asset prices and returns will eventually gravitate back to their historical average or long-term baseline over time. When prices deviate significantly from this mean due to market overreaction, fear, or greed, mean-reversion strategies assume the price will eventually snap back.
Look at the S&P 500 data from 2000 to mid-2026. It perfectly illustrates how mean reversion operates on a macro scale—and why it’s so critical for risk management right now.
1. The Historical Growth BaselineSince the March 2009 low, the S&P 500 has followed a long-term exponential trend line representing roughly 11% annualized growth (the dashed gold line). This line acts as the market's historical "mean" or gravity well.
2. Corrections vs. Structural Trend BreaksThe market handles deviations from this line in two distinct ways:The "Healthy" Corrections (Amber Shading): In 2011, 2015, 2018, 2020, and 2022, the market stretched a bit too far or faced short-term macro headwinds. It pulled back (ranging from -9% to -34%), but the long-term trend held. These wereic, short-term mean reversions that reset investor sentiment without breaking the structural bull market.
The Structural Bear Markets (Red Shading): In 2000 and 2007, the market didn't just experience a minor pullback; it suffered massive structural breaks (-49% and -57%, respectively) that completely severed the existing trend, forcing a grueling multi-year process to establish a brand-new baseline.
3. The 2026 Reality: An Unprecedented StretchAs of May 2026, the S&P 500 has surged to a staggering 7,399, putting it +83% above its long-term trend line.According to historical data, this is the widest deviation above the trend line in this entire bull market's history. The rubber band has never been stretched tighter.
The Investor's TakeawayMean reversion doesn't tell us when the market will turn—it operates on a lagging timeline that can test an investor's patience for years. The market can remain extended far longer than logic dictates.
However, data like this serves as a vital reminder for asset allocation. When the gap between price and the historical mean reaches historic extremes, the forward risk-to-reward ratio changes. It doesn't mean you panic-sell, but it absolutely means you double-check your risk tolerance before assuming the rubber band can stretch forever.
Never bet on an indefinite vertical climb without remembering that gravity always wins in the end.
Chart by Lance Roberts